
UPM-CDF-SLI-2026-09
The Cardiff Short Let Index
A monthly measure of forward calendar unavailability across tracked short lets within ten kilometres of Cardiff city centre.
Market snapshot
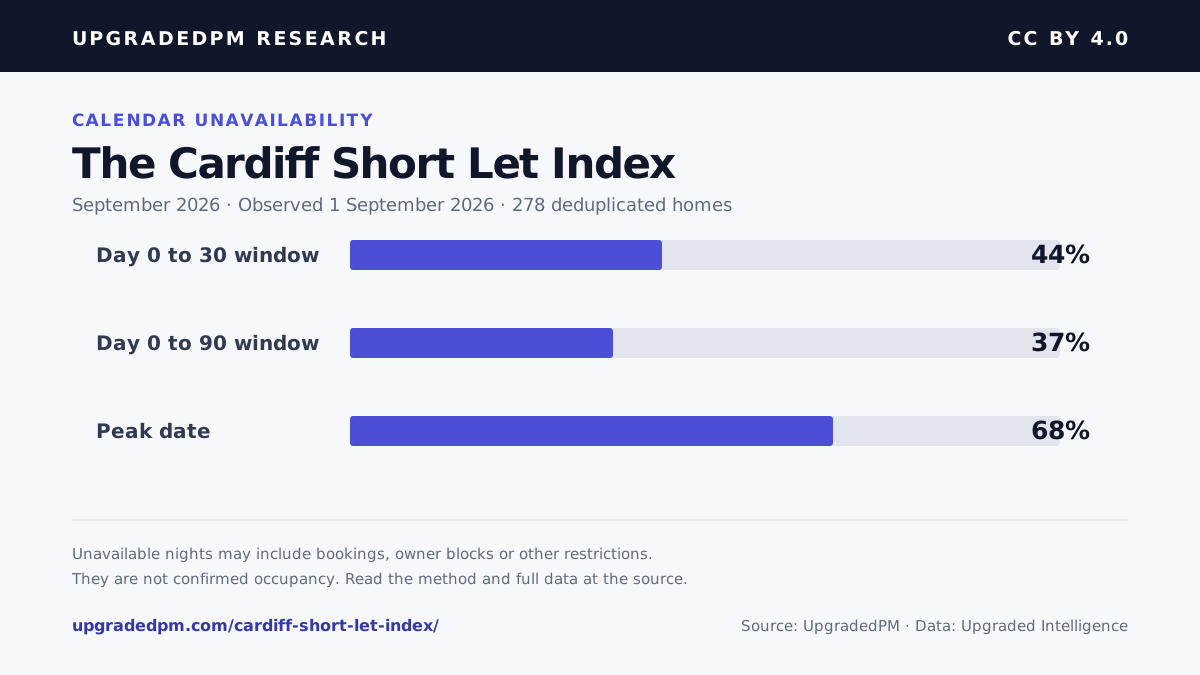
37%
Day 0 to 90 window unavailable
91 observed calendar dates
47%
Friday and Saturday dates unavailable
Within the day 0 to 30 window
68%
Peak date unavailable
Tuesday, 1 September
278
Unique homes in the reading
All 31 dates cleared the gate
What the latest reading shows
Tuesday, 1 September
Weekday pattern and release sample
Within the day 0 to 30 window, Friday and Saturday calendar dates showed 47% unavailable share versus 43% for Sunday to Thursday dates. The minimum valid daily sample was 274 homes.
Calendar unavailability by weekday
Unavailable share from the observation date through day 30 inclusive.
- Friday and Saturday dates
- 47%Day 0 to 30 window
- Sunday to Thursday dates
- 43%Day 0 to 30 window
- Days 0 to 6
- 53%Seven calendar dates
- Lowest date
- 29%Sunday, 27 September
What cleared the release gate
Availability and price evidence are assessed separately.
- Unique homes
- 278Fresh and geographically valid sample
- Day 0 to 30 dates published
- 31/31All 31 dates cleared the minimum sample
- Home date observations
- 8,504Across the inclusive window of 31 calendar dates
- Priced dates clearing input
- 12/31Below the 20 date rate threshold
Monthly index series
Each future release will use the same geography, freshness rule and minimum sample threshold.
| Reading | Day 0 to 30 unavailable | Day 0 to 90 unavailable | Friday and Saturday dates | Unique homes | Observed |
|---|---|---|---|---|---|
| September 2026 | 44% | 37% | 47% | 278 | 1 September 2026 |
From the UK corpus to one Cardiff reading
The Cardiff index narrows the national warehouse to fresh, deduplicated homes inside its fixed footprint. The wider corpus is shown for provenance, not presented as the Cardiff sample.
10.36M
Night-level records
Observed availability states in the research warehouse2.07M
Priced night records
Rows carrying a usable nightly price observation120,143
Listing profiles catalogued
Discovery coverage before freshness and market-level deduplication99.6%
Profiles geocoded
119,707 profiles with usable coordinatesWarehouse coverage spans 4 June to 15 August 2026. Profile counts describe the UK discovery corpus, not active supply in this market; every published index applies its own geography, freshness, duplicate and minimum-sample rules. The corpus totals are the conservative 16 August audit. This market reading uses a later snapshot observed on 1 September 2026.
Methodology and publication notes
The index uses the latest valid availability observation for each deduplicated short let inside a fixed ten kilometre Cardiff footprint. The primary figure covers the observation date through day 30 inclusive, 31 calendar dates, and the extended figure covers the observation date through day 90 inclusive, 91 calendar dates. An unavailable date may be reserved, owner blocked or withheld for another reason, so this is not realised occupancy.
Fixed Cardiff footprint
Every release uses the same ten kilometre radius around Cardiff city centre.
Fresh observations only
A calendar state must have been observed within five days of the reading date.
Each home counted once
Listings within 150 metres are grouped before the daily unavailable share is calculated.
Rate held back
Only 12 of the 31 dates from the observation date through day 30 carried a valid daily price median. The rate needs at least 20 and is not published.
Assess an individual Cardiff property
The index is a market benchmark. A property forecast can account for the exact address, size, finish and operating plan.