
UPM-LON-SLI-2026-09
The London Short Let Index
A monthly measure of future calendar unavailability across tracked short lets within ten kilometres of central London, with professional rate evidence reported separately.
Market snapshot
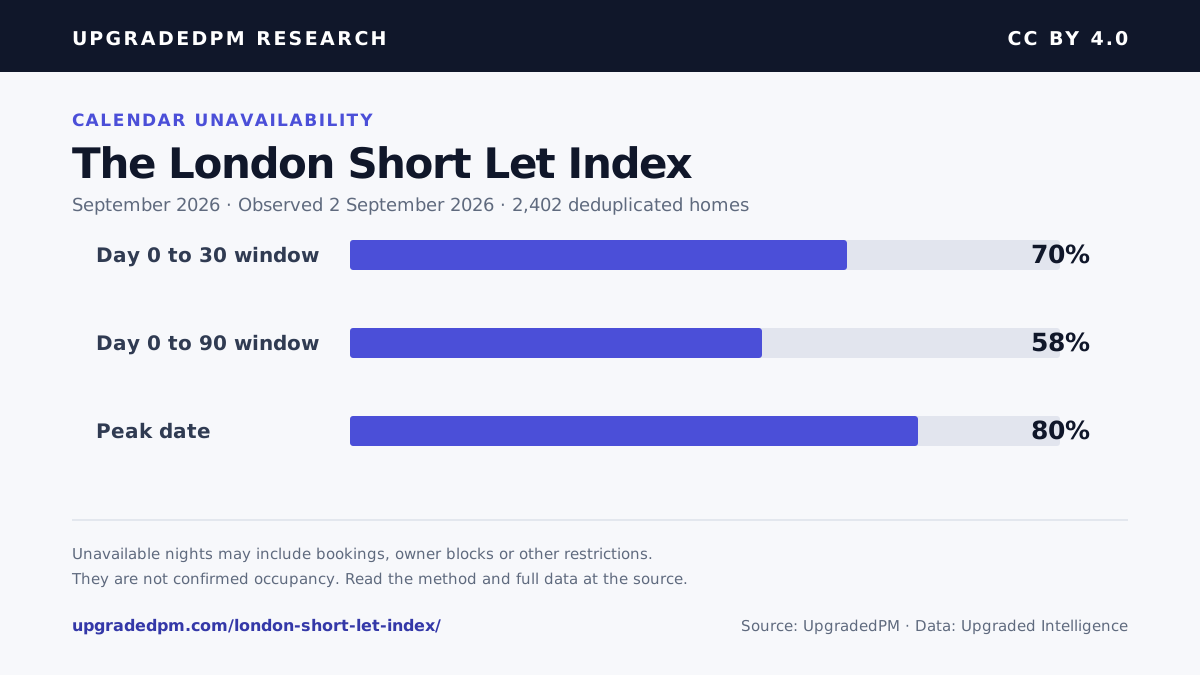
58%
Observation date through day 90
Whole tracked market
£222
Median nightly rate
Professionally priced portfolios · day 0 through day 30
80%
Peak date unavailable share
Friday 4 September
2,402
Unique homes in the reading
22 contributed valid price observations
What the latest reading shows
Friday 4 September
Availability, price and sample depth
The September headline cleared the full publication gate across a much deeper sample. The archived August curve remains visible as historical context rather than being rewritten with the new headline.
What cleared the September gate
The daily sample remained above the publication threshold across every date in the current reading.
- Unique homes
- 2,402Deduplicated across the ten kilometre footprint
- Minimum daily sample
- 2,347Lowest valid home count across the current window
- Dates clearing the gate
- 31/31Every near term date met the sample threshold
- Fully unavailable dates
- 0No date was treated as completely unavailable
Professional price evidence
Price evidence uses 22 professionally priced homes and is kept separate from the wider availability sample.
- Median daily rate
- £222Published September index rate
- Professionally priced homes
- 22Separate price population
- Priced dates
- 31/31Every near term date supplied a valid daily median
- Fixed London footprint
- 10 kmCentred on the same London reference point each month
Monthly index series
Each release is appended to this table using the same geography, freshness rule and minimum sample threshold. Published rows are not silently revised.
| Reading | Day 0 to 30 unavailable | Day 0 to 90 unavailable | Professional median rate | Observed |
|---|---|---|---|---|
| September 2026 | 70% | 58% | £222 | 2 September 2026 |
| August 2026 | 61% | 50% | £176 | 12 August 2026 |
From the UK corpus to one London reading
The London index uses only the fresh, deduplicated homes that clear its fixed central footprint and daily sample gate. The wider warehouse is shown to document provenance, not to inflate the local sample.
10.36M
Night-level records
Observed availability states in the research warehouse2.07M
Priced night records
Rows carrying a usable nightly price observation120,143
Listing profiles catalogued
Discovery coverage before freshness and market-level deduplication99.6%
Profiles geocoded
119,707 profiles with usable coordinatesWarehouse coverage spans 4 June to 15 August 2026. Profile counts describe the UK discovery corpus, not active supply in this market; every published index applies its own geography, freshness, duplicate and minimum-sample rules. The September headline and gate metrics use the 2 September window. Supporting curve cuts use the archived 12 August window, and the August release remains visible rather than being rewritten.
Methodology and publication notes
The index uses the latest valid availability observation for each deduplicated short let in the fixed central London sample. The primary window runs from the observation date through day 30 inclusive, covering 31 calendar dates. Unavailable percentages and professional rate evidence are calculated independently.
Fixed central London footprint
Every release uses the same ten kilometre radius centred at 51.5074, -0.1278.
Deduplicated tracked supply
Duplicate listings are collapsed before calculation so the same home cannot inflate the sample.
Availability boundary
Unavailable nights may be booked, owner blocked or otherwise restricted. They are not confirmed occupancy.
Samples published
The current reading contains 2,402 deduplicated homes, with a minimum of 2,347 valid homes on every observed date.
Separate price population
Unavailable shares cover the wider valid sample. The £222 rate uses 22 professionally priced homes only.
Comparison boundary
The sample expanded from 17 homes in August to 2,402 in September, so the difference between releases is not a pure demand trend.
Publication threshold
The rate is published only when at least five priced listings contribute valid daily medians on at least 20 of the 31 dates from day 0 through day 30.
Assess an individual London property
The index is a market-level signal. A property forecast can account for location, size, finish and the intended letting strategy.