
Monthly market index UPM-BRI-SLI-2026-09
The Bristol Short Let Index
A repeatable monthly measure of future calendar unavailability across Bristol's tracked short let market, based on observations within ten kilometres of the city centre.
01
Current evidence
Market snapshot
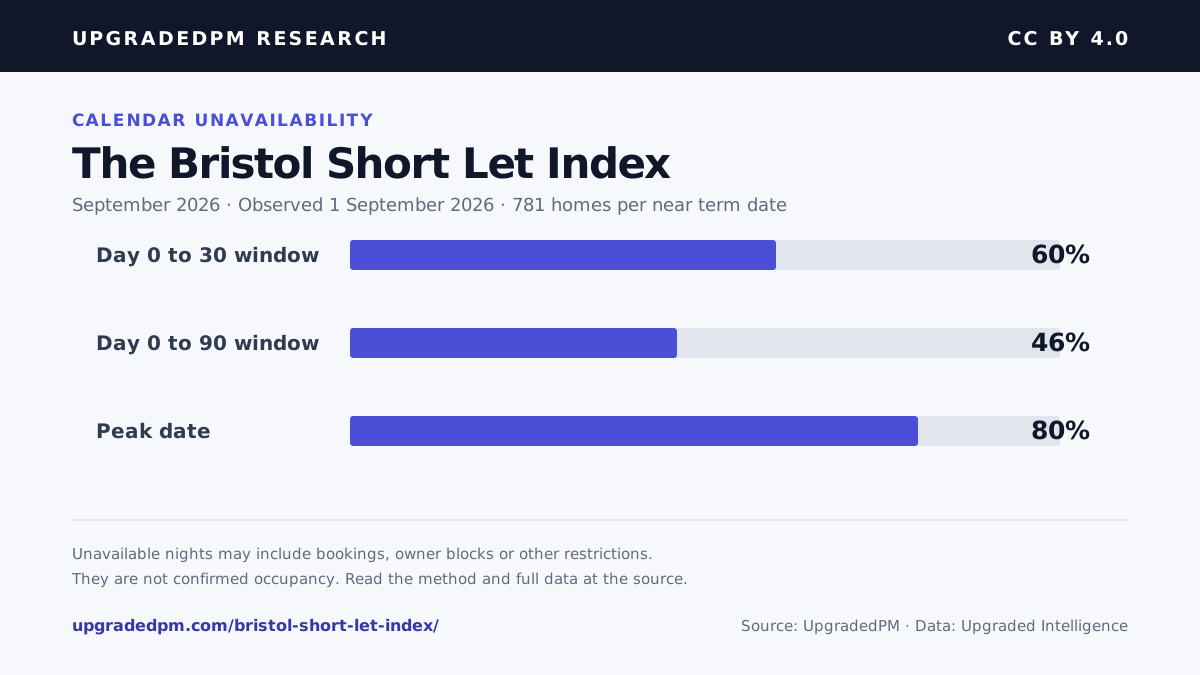
46%
Observation date through day 90
Whole tracked market
68%
Friday and Saturday unavailable
Observation date through day 30
80%
Peak night unavailable share
Tuesday, 1 September
781
Homes per near term date
31 of 31 dates cleared the sample gate
02
Comparative view
What the latest reading shows
Tuesday, 1 September
03
Reading detail
Availability, price and sample depth
These supporting cuts show when the unavailable share was highest, how much evidence cleared the availability threshold and why no September nightly rate is published.
When calendar unavailability was highest
Unavailable share within the same September observation window.
- Friday and Saturday nights
- 68%Observation date through day 30
- Sunday to Thursday nights
- 57%Observation date through day 30
- Peak night
- 80%Tuesday, 1 September
- Softest observed night
- 43%Wednesday, 30 September
Publication gates and sample depth
Availability cleared the publication gate. Price evidence did not, so no September nightly rate is reported.
- September nightly rate
- Not publishedPrice evidence was below the publication gate
- Listings with valid prices
- 3Too few for a representative market rate
- Dates with price medians
- 12/31Too few dates for a monthly rate
- Dates clearing the availability gate
- 31/31781 homes per near term date
04
Published data
Monthly index series
Each row preserves its published reading. The sample grew from 217 homes in August to 781 in September, so changes can reflect both market conditions and the different properties observed.
| Reading | Day 0 to 30 unavailable | Day 0 to 90 unavailable | Professional median rate | Observed |
|---|---|---|---|---|
| September 2026 | 60% | 46% | Not published | 1 September 2026 |
| August 2026 | 61% | 53% | £105 | 3 August 2026 |
05
Data coverage
From the UK corpus to one Bristol reading
The index is a narrow, reproducible cut from a much larger research warehouse. Corpus scale is disclosed separately from the local sample so large row counts cannot be mistaken for Bristol supply.
10.36M
Night-level records
Observed availability states in the research warehouse2.07M
Priced night records
Rows carrying a usable nightly price observation120,143
Listing profiles catalogued
Discovery coverage before freshness and market-level deduplication99.6%
Profiles geocoded
119,707 profiles with usable coordinatesWarehouse coverage spans 4 June to 15 August 2026. Profile counts describe the UK discovery corpus, not active supply in this market; every published index applies its own geography, freshness, duplicate and minimum-sample rules. Supporting cuts use the 1 September observation window; earlier monthly headlines remain unchanged in the series.
06
Transparency
Methodology and publication notes
Upgraded Intelligence records date by date availability and pricing for active short let listings. The index takes the latest valid observation for each listing and calculates the unavailable share from the observation date through day 30 inclusive, a 31-date window.
Fixed geography
The same ten-kilometre radius around central Bristol is used for every release.
Comparable calculation
Each property contributes its most recent valid availability observation; duplicate and stale records are removed before aggregation.
Availability boundary
Unavailable nights may be booked, owner blocked or otherwise restricted. They are not confirmed occupancy.
Price publication gate
Unavailable percentages cover the whole tracked market. A nightly rate is published only when the separate professional price sample is broad enough to support it.
Minimum sample threshold
Dates with too few valid properties are excluded rather than estimated, protecting the integrity of the published average.
Property owners
Turn the city-wide reading into a property-specific forecast
A market index describes Bristol as a whole. A valuation accounts for your address, property size, finish and operating model.