
The latest releases, applied to your property
UK property market in October 2026: the landlord’s view
Slower price growth makes the headlines. Your next mortgage payment and the rent your home can sustain deserve just as much attention.
Explore the market figures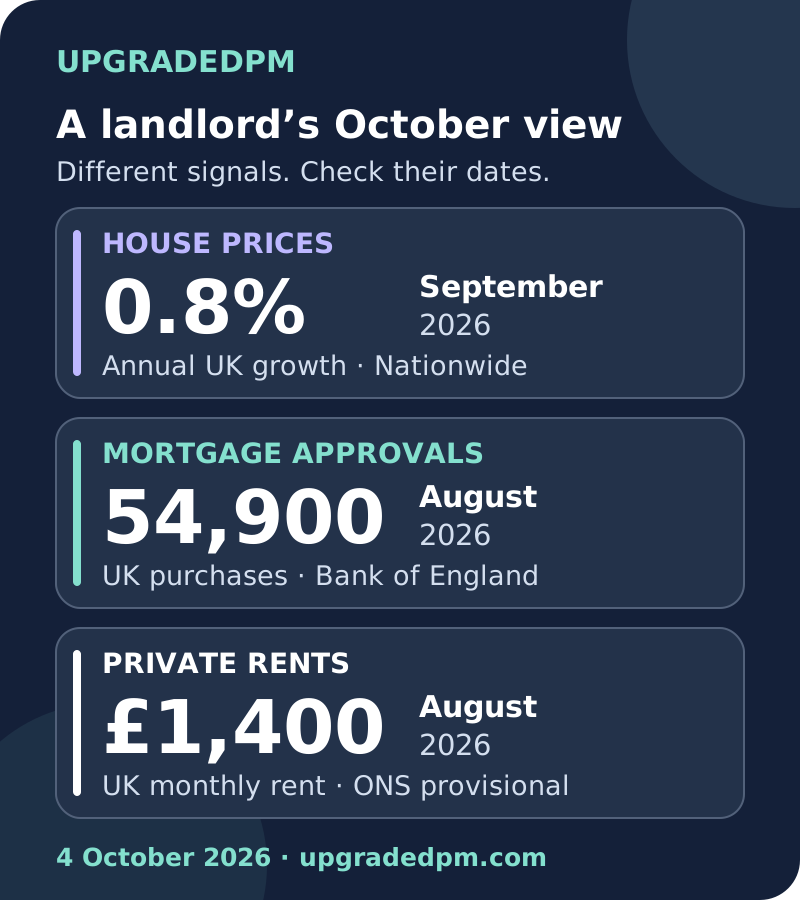
A property can be worth more than it was a year ago and still leave its owner with less money each month. That is why a house price headline is only the start of a useful landlord review.
The newest releases available on 4 October show weaker annual house price growth, fewer purchase mortgage approvals and continuing rent growth. Borrowing costs have also risen. Together, they give an owner a reason to check the property’s actual income and financing before making the next decision.
Our sister research business, Upgraded Intelligence, sets out the October national evidence. This report takes those verified releases and asks what they mean when you have a home to let, a mortgage to renew or a possible purchase to assess.
Choose the figure you want to understand
Read the prices, borrowing and rent figures.
House prices tell you about values. Approvals give a view of future borrowing. Rents describe the private rental market. Look at the date as well as the number, because these releases do not all measure the same month.
September 2026 · House prices
0.8%Annual UK house price growth
Annual price growth slowed in September.
Nationwide’s annual measure eased from 1.6% in August to 0.8% in September. Its monthly change was a fall of 0.2% after seasonal adjustment. Read the Nationwide release.
A lower annual growth rate still means prices were higher than a year earlier. The monthly fall answers a different question about the movement within September.
If you are buying or selling, check comparable local homes and the property’s condition. A national index cannot tell you what someone will pay for your flat.
Annual change
Bars start at zero. This compares annual growth rates, not the percentage fall in property values.
These are September price observations. The ONS house price reading below covers July and uses a different index.
August 2026 · Mortgage approvals
54,900UK house purchase mortgage approvals
Fewer purchase mortgages were approved in August.
The Bank of England recorded 54,900 house purchase approvals in August, down from 55,900 in July. The figures are seasonally adjusted and net of cancellations. Read the Bank of England release.
Approvals indicate future borrowing. They are not completed sales, a count of landlords buying homes or a measure of tenant demand.
If a purchase depends on a mortgage, use the lender’s actual offer and timescale in your plan. This national count will not tell you whether your own application will succeed.
Approvals
Bars start at zero. The small difference is 1,000 approvals, rather than a collapse in lending.
These are August lending observations from the release published on 29 September.
August 2026 · Private rents
£1,400Average UK monthly private rent
Average private rents were still rising in August.
ONS puts average UK monthly private rent at £1,400 in August, with annual growth of 3.8%. The annual rate was 3.7% in July. These estimates are provisional. Read the Office for National Statistics release.
This is a measure of the private rental stock, with collection differences across the UK. It is not a price list for newly advertised homes or short let nights.
For a new tenancy, compare relevant local homes and the enquiries your advert attracts. For an occupied home, look at the tenancy, the current rent and the permitted process before deciding what to change.
Annual change
Bars start at zero. These show annual growth rates, not the monthly increase in rent.
These are August rent observations. The same ONS bulletin reports house prices for July.
The figure that reaches your bank account
Your own mortgage matters more than the average.
The Bank of England’s August release puts the average effective interest rate paid on newly drawn mortgages at 4.60%, up from 4.45% in July. This is the interest actually paid on that group of new loans. It is not Bank Rate or a buy to let offer.
An owner still on an older fixed rate may not feel that change today. Someone approaching renewal has a different decision to make. Use your current balance, the end of the fixed period, the proposed rate and the fees to work out the cost of the next loan. An average from a report cannot replace those details.
The practical question is whether the rent left after running costs still covers the property comfortably. Allow for repairs, management, insurance and time between tenancies as well as the mortgage. A rise in the headline rent may be smaller than a rise in the costs.
If a renewal is close, get an actual lending assessment early enough to compare the options. Keep the property budget beside it. Seeing the new payment in the same place as the net rental income makes the decision much easier to understand.
A rising average is not a rent instruction
What will someone pay for this home?
The latest ONS rent bulletin gives a national backdrop. It cannot tell you whether your two bedroom flat should be £50 more expensive, whether the current tenant would stay or how long a replacement tenancy would take to arrange.
For a vacant property, look at homes that a prospective tenant would actually compare with yours. Match the location, bedroom count, condition and furnishing as closely as you can. Asking rents give you a starting point. The response to a well presented advert tells you whether your own price is convincing.
For an occupied property, a rent review is also a tenancy decision. Understand the current arrangement and the applicable process before discussing a change. A reliable tenant and a well maintained home have a value that does not appear in the national percentage.
Before turning a headline into a valuation
A national price rise can hide a different local market.
Nationwide’s regional figures put South West annual house price change at a 0.3% fall in the third quarter of 2026. Those figures cover the three months to September. They are a regional comparison, while the 0.8% national reading above is a monthly index’s annual change.
The same report can therefore contain a positive UK reading and a weaker South West one. Neither establishes the value of a particular Bristol property. The building, street, lease, condition and comparable transactions still matter.
The official ONS house price estimate is another distinct observation: £273,000 across the UK in July, with annual growth of 1.4%. It is provisional. You cannot read July’s ONS figure followed by September’s Nationwide figure as a single timeline of changing property values.
If you are assessing a purchase, test the rent and the likely operating costs at the price you would actually pay. A modest price reduction will not rescue a home with weak rental demand or an expensive maintenance problem. If you are selling, use recent relevant evidence and a realistic marketing plan rather than applying a national percentage to last year’s valuation.
Considering a different letting route?
Short lets need a separate set of numbers.
Residential rent growth does not tell you what a holiday let will earn. A nightly price also leaves a lot of the story out. The dates that sell, the quiet months and the cost of running each stay decide how much is left.
Our winter short let guide lets you change the paid nights in a worked budget and compare the result with a residential tenancy. It is a useful way to test what a quieter month would feel like before choosing a route based on the best summer week.
Management should be part of that comparison. Ask what the fee covers, who handles repairs and guest or tenant problems, and which costs remain yours. Our Bristol management company comparison helps you compare the service as well as the advertised percentage.
Evidence available on 4 October 2026
Check the source and its month.
Nationwide’s September house price report supplies the monthly and annual price changes and the third quarter regional comparison. Monthly changes are seasonally adjusted.
The Bank of England’s August Money and Credit release, published on 29 September, supplies the approvals and effective interest rates. Its next release is scheduled for 29 October.
The ONS September rent and house price bulletin, published on 16 September, supplies August rents and July house prices. These estimates can be revised. ONS lists 21 October as its next release date.
This is UpgradedPM’s original landlord interpretation of the evidence discussed in Upgraded Intelligence’s October national note. Our practical examples are illustrations. None of the national averages is a valuation, mortgage offer or forecast for an individual property.
Questions behind the figures
What the report can tell you.
Are these figures measuring the property market in October?
This report was published on 4 October 2026 using the latest releases available then. Nationwide prices cover September. Bank of England approvals and ONS rents cover August. ONS house prices cover July. The figures describe different periods and measures.
Does 0.8% house price growth mean property prices fell?
Nationwide’s annual reading means prices were 0.8% higher than a year earlier. Its separate monthly reading shows a 0.2% fall during September after seasonal adjustment. Slower annual growth and a monthly fall can happen together.
Is 4.60% the mortgage rate I can get?
It is the Bank of England’s average effective interest rate paid on newly drawn mortgages in August 2026. It is not Bank Rate, a buy to let quote or a mortgage offer. Your loan, fees and eligibility need a separate assessment.
Should I increase my rent because the UK average rose?
A national average does not establish the right rent for your home. Check the local market, the property’s condition and the tenancy before deciding. For a Bristol property, our local rental report provides a better starting point than the UK average.
Do these figures show whether a short let will make money?
No. They cover house prices, mortgage activity and private residential rents. A short let forecast needs its own evidence about rates, paid nights, seasonality and operating costs. Our winter guide lets you compare a worked short let budget with a residential tenancy.